A new Deltares Aqua Monitor tool empowers anyone with a web browser to observe water’s constantly shifting courses, and respond accordingly to what satellites reveal. By James Workman
For eons our planet has always held the same amount of water but that quantity has not stayed accessible, local or stable over time.
On the contrary, fresh water moves. It rises, falls, dries, floods, fills in, sinks down, runs off, and backs up. Meanwhile, more erratic rains cease, come down harder, or fall in different places.
Yet constant change by our fugitive resource has been impossible to keep track of, until now.
A team at Deltares, a water research institute based in Delft in the Netherlands, has unveiled a revolutionary tool that allows anyone, anywhere, to visually monitor the comings and goings of the Earth’s surface water on a timeline from 1985 through to the present. Access to the technology is free, providing us with a fascinating open access window on our thirsty world.
“The Aqua Monitor is a set of mathematical equations,” explains Jaap Kwadijk, Deltares Scientific Director. “It provides you with information on how much water has turned into land, and how much land has turned into water. It allows us to look to trends in climate change. Scientists can look to see where the world is becoming wetter or drier. This has never been done before.”
The tool is anchored by Google Earth Engine, which incrementally stores satellite images over time, and script data to access it. It also relies on four Landsat earth-observing satellite missions, managed by the United States Geological Survey (USGS) and the North American Space Agency (NASA).

But Deltares and the Delft University of Technology deserve credit for weaving these technical strands together into a pixilated composition at the remarkable resolution of 30 metres, and making it simple and accessible to any curious surfer with a Wi-Fi connection.
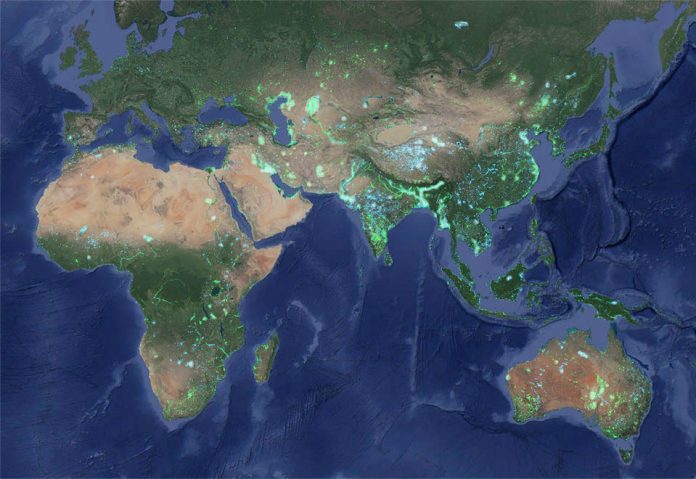
Zooming in, green indicates where land has overtaken water; blue reveals the spread of water. Nature Climate Change published their paper on the global results: that the world has gained 115,000 km2 of water and 173,000 km2 of land over the past 30 years. Two areas were identified to provide the largest contribution regarding surface water gains (Tibetan Plateau) and losses (Aral Sea).
“Globally, a surface equal to the area of Washington State was converted from water to land,” Hessel Winsemius, a Deltares hydrological expert explained in a webinar, “while an area two-thirds of that was converted from land to water.”
The causes of those changes depend on local context, of course, and that’s where the tool may gain the most traction and interest. Over the last three decades you can watch Lake Chad or the Aral Sea shrivel and contract in excruciating detail.
But there’s a positive side, says Fedor Baart, a Deltares expert on integrated modelling. Contrary to expectations of widespread coastal erosion, Deltares researchers discovered a surprising amount of residential land reclamation strategies. These showed up most aggressively off Dubai, Singapore, the Netherlands, and especially southern China. The latter shows, “almost unimaginable” coastline land growth from Hong Kong to the Yellow Sea within the last decade, and indicated to Baart how “we have a huge engineering power, able to deal with sea level rise.”
Still, with power comes responsibility. He points out some of the many dam reservoirs shown to be filling in behind the borders of politically closed, opaque countries. “We see quite a few of them popping up every year, more than reported.”

Indeed, Myanmar had listed the creation of 400 square kilometres of new reservoir surface area, when Aqua Monitor counts 1,180 square kilometres, nearly three times that amount. It also showed the previously unmapped damming of the disputed transboundary Rimjin River east of South Korea’s border, by North Korea’s Hwanggang Dam. The heightened scrutiny, and awareness of transparency, may have political repercussions on decision-making and national security relations among basin-sharing states of transboundary rivers.
Gennadii Donchyts, an expert in remote sensing, developed the tool as part of his Ph.D. study at the Delft University of Technology. “The real power,” he says, “is the ability to combine large computing infrastructure, co-located with huge amounts of satellite data, and the simplicity of the algorithm, allowing us to answer scientific questions which would take a hundred years to compute otherwise.”
Any local, regional or global water professional–or for that matter layman who requires objective water information–can use the tool to look upstream and downstream at new man-made water or land, wetland loss, sedimentation, or coastal erosion.
Questions remain unanswered about who, why, and how to develop the tool’s application. But that’s the point. The overall goal is to invite other researchers and institutions to build on the tool’s foundation and take it in new directions.
As Donchyts, the initial creator of AquaMonitor, concludes: “I think we are only beginning to explore what is possible with this technology and exponentially growing volumes of freely available Earth Observation data.”


